This project is my pride and joy, because I’ve been working on it for two years now, and I built it up from scratch from receipts, collecting all of the data I possibly could. It was a lot of manual data entry, but it helped me get a better understanding of what I wanted and how to structure the table.
There will be more visualizations on my Tableau Public page, and in the gallery of my work, but for now this is just in the beginning stages. There is a lot that I want to try and work out of this data, because there is so much of it.
If I get especially thorough on anything when it comes to data analysis, it’s figuring out the questions that I have and how I can go about answering them in the best way possible. I’ve spent hours before just listening to music and thinking about datasets and what I could pull from them, what the best way is to visualize the information there.
Data mining tends to be my favorite part of the entire process so far, but preparing my questions and hypotheses works into that as well. It feels like a creative, problem solving phase that allows my brain to run wild.
The question I started collecting the data for in the first place was, “what happens to the average of spending on weekly grocery trips as the supply chain is affected?”
There are still plenty of other questions to be asked of it, though.
What happens to the average when the CDC recommends single weekly trips for groceries and the household is used to doing more than one?
What happens to the average spent on any specific category?
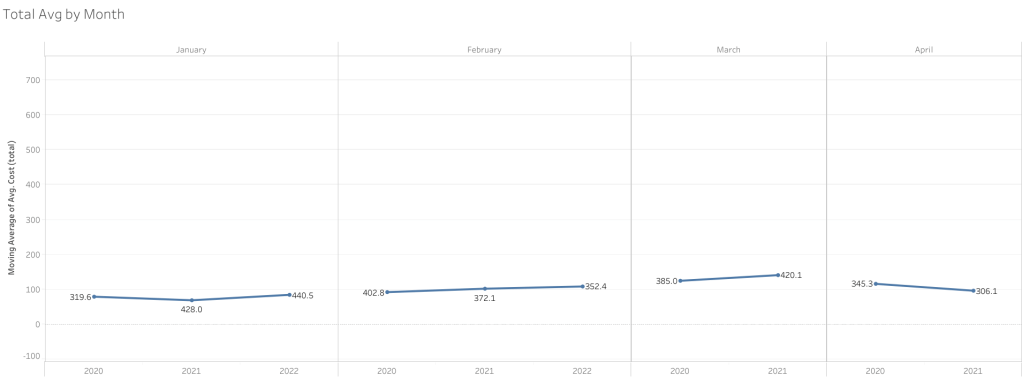
Month by month, throughout each year, how much is spent on average, and are there specific days or holidays where it gets worse?
I would love to line up a trend line for each year of groceries, with current events happening and how it affects spending. As it happens, I still feel like I understand the basics of data analysis but I’m slowly learning the more advanced pieces of how to display and how to visualize the data to give the best understanding.
For now, this will have to do, with my current working knowledge of both excel and tableau for pivot tables and visualization. I hope that you’re looking forward to watching my skills evolve as much as I am as I spend more time on this data analysis journey.
Remember that you can keep an eye on my Tableau visualizations on my profile page here and that you can download any of them to view the entire workbook.
As always, I will see you all next week for the next post, and until then, I hope your data cleaning is swift and simple!

Leave a comment