When I was writing about the project roll call last week, it was surprising to me just how little I’ve talked about all of the other projects I’m running and currently working on. Though the baseball analysis has come down to the “compile findings together” phase, and I have plenty I could talk about with regards to wrapping up a project and deciding when it’s finished– to say nothing of when I did that for the portfolio builder class– there’s still so much else to talk about.
I’m doing what I can to make sure this doesn’t end up sounding like a personal blog over a portfolio one, but the truth is that that’s kind of hard for this project.
Ultimately I took a personal moment– a vacation– as an opportunity to do some analysis that’s unique.
And it was unique. I may have overheated taking all of the pictures in the afternoon sun when it was close to 100 degrees, so I could capture the data separately, at a different time.
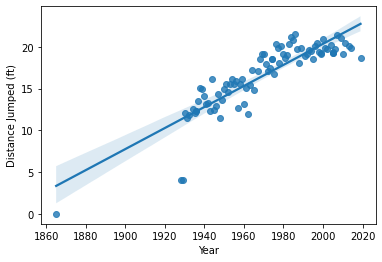
Those pictures were the 88 total pictures of the Calaveras Jumping Frog winners all the way back to about 1928, with 1865 as an honorable first mention. 1865 also managed to be the shortest winner at a total jumping distance of… 0’0.
I did a little bit of research as well into this, just to see if any data had been gathered before, what existed out there, what kind of information was readily available, what kind of articles had been done, etc. I did find a small analysis done by someone else about the Calaveras Jumping Frogs, but this one was done on the frogs themselves: do they need to warm up and who do they belong to (ie: are they rented? Yes. You can rent frogs).
You can view that project, done by Jennybc, here.
Like my grocery data, I eventually want to make this frog data public. In it is all of the data you’d get from the plaques, plus the pictures themselves if you wanted to do an image analysis. The data includes, name of frog, year, owner/team, where the person is from, and of course, the distance jumped. Each World Record holder is marked on the plaque as well.
So far what has been done with it is just a basic scatterplot analysis of jumping distance across year. Though the jumping distance seems to get bigger and longer as the years go on, no one has beaten out Rosie the Ribiter yet, from 1986, at 21.5 feet.
What I want to do is a location plot, across the Western coast of the US. I may end up needing to grab location data (longitude, latitude) for each city. I’m a little hesitant to get into that part of the analysis if only because looking at the code for some of those bubble geo plots is intimidating as hell. I’ve been getting by with less intense code for the moment, but I’m going to need to sit down and work at this one with a little more effort.
My overall goal is just to show the data I have and say, this is about the average jumping distance, this is where winners tend to come from, and these are the years of the world record winners.
So just basic information. I may end up creating an infographic for it, or at the very least a small presentation. Just having the data will be fun, and I can try to customize the visualizations I make.
You can check out the repository I’ve created for this analysis on my Github, here!
I’m having a hard time trying to figure out how to visualize the categorical data– that always tends to be hard for me– but I hope that I can come up with something more for this. It isn’t a *lot* of data by any measure (88 entries) but only having a couple of plots feels like I’m not utilizing everything.
Either way, this has been a fun project. Maybe I’ll do something with the pictures I took. Those pictures are all on the repository as well, by the way.
Next week I think I’ll do another deeper look at one of my other projects I’ve done, if I don’t talk about the classes I’m currently in and finishing. Until then, I hope for you the swiftest cleaning and the prettiest data!

Leave a comment