Well, it’s another post about women in data. Who would have guessed?
The Datathon hosted by WiD is the first data/coding competition I’ve ever registered or competed in at all. I’ve heard about the Kaggle competitions and I believe there’s a website specifically for competitions like for machine learning. Plenty of opportunity, but this was the first one I thought to enter.
I was really excited about this experience when it got started. I was working with people who I had worked with in the past, but as time wore on, more and more of the team started to fall apart. At the end, it was me and one other woman who crossed the finish line, someone who needed a team.
I won’t lie, this got kind of rough. With people dropping out– we started with five– it was sort of a touch and go situation. We were having a hard time coming up with a problem statement because we were losing people but wanted to keep the momentum going. Eventually we came up with a broad problem statement, about a week, week and a half before the project was due in full.
Cleaning was also one of the harder parts of this project. We decided on a dataset from the US Census and it was my first time encountering the weirdness that was that format.
Funny enough, I didn’t figure out an easier way to gather that data until after the datathon was through: APIs tend to be the answer for the .gov datasets, typically.
We did a lot of cleaning on the Census data with the way we got it. I broke down a lot of the formatting, took things through educational levels and eventually put them in their own separate excel sheets. My partner was able to come up with a couple of columns that better defined the gender pay gap as we saw it in the dataset, and I applied those to the rest of the data. Then, I created my own csv with the formula for those new columns, applied to the other educational levels. So that new csv was just those two columns across all educational levels…
Does that make sense?
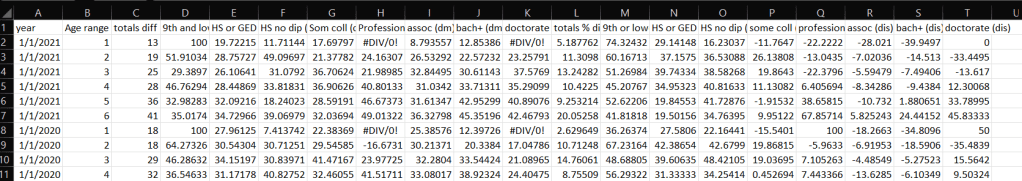
The two that you see there “Diff” or “dm” is shorthand for % difference of mean earnings between men an women. % dis or “dis” is the disparate proportion of men to women making an income as represented in the dataset.
Overall it’s really interesting data. The only problem was that there really wasn’t much in the way of raw entries. It was collected across six different age ranges, several different educational levels, but they were all broken up in a way that didn’t lend well to training and testing models. After all the cleaning, I think we came up with about 66 rows.
When we finally got more focused and decided we would continue with the datathon despite everyone else dropping out of our team, I had decided to do the analysis, and my partner did the modeling.
There was a dataset that I wanted to use for additional analysis, but we decided not to include it in the final project. I’m going to focus on creating a dashboard with that information now that the competition is over, though.
The recording is where I really ran into a lot of bad luck. We didn’t have much time to begin with, and then I was having difficulty with premiere pro on putting the videos together. It was a whole mess. I submitted what we had just in time before the deadline– I think it was about 4 minutes to spare.
I’m glad that we were able to finish and submit everything, despite all of the issues we ran into.
I am kind of glad the datathon is over, to be honest! It was definitely a whirlwind, it was fun to get into the Census data, and now that I know a way to get the data without needing to deal with the weird formatting, I may try to do some analysis with a different census dataset.
Though I don’t think that’s the last competition for me. I saw that Kaggle has a few competitions they’re hosting with some survey data that they have and I think something else. It looked really interesting and I think I might poke my nose into it just to see.
I haven’t been aware of data analysis/data science competitions for very long, but I started out being pretty averse to them mostly because I’m still learning. I always thought someone else would come out on top and shine brighter than I possibly could, so why should I try?
The answer to that is that I should try because I can. You never know what the competition is going to be like and if you only do it to get your hands on the data or try something new, that’s more than good enough of a reason.
I’m not honestly very proud of the work I did in this competition, but I’m hoping that the next will be better.
Here is the link to all of the Kaggle competitions, by the way!
And the specific one I mentioned about the survey data.
Thanks so much for sticking with this post, and I hope that if you entered the datathon or plan to enter any other data/ML competitions, that you have the best of luck!

Leave a comment