My original plan with this was to create a bunch of visualizations with Python and continue my work and learning with that language. After an interesting conversation during an interview process, I realized that I have all kinds of tools at my disposal. I can do more than just work with Python.
Method
So instead, I used this as a chance to create something with Tableau. I knew that it would suit my needs with the plans I had to visualize the city that the winners are from.
When I was tinkering in Jupyter Notebooks with Python, I did get this lovely line chart about the distance jumped across time:
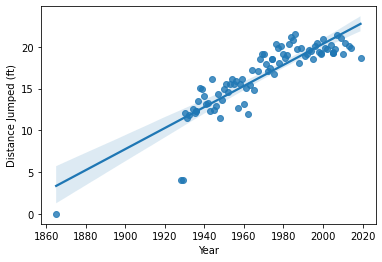
As much as I love plotly express, when I tried to create a line chart, something must have gone wrong and it looked like one big scribble. However, Tableau showed me a much cleaner line chart.
That’s on the methodology that I chose, and why. Next I want to get deeper into the actual insights that I’ve derived.
Insights
The dataset that I put together from the pictures I took of the boardwalk frog plaques is small. In total there are 88 entries. Right away, there’s nothing deep and insightful that I was expecting to pull from this, but it does create fun visualizations.
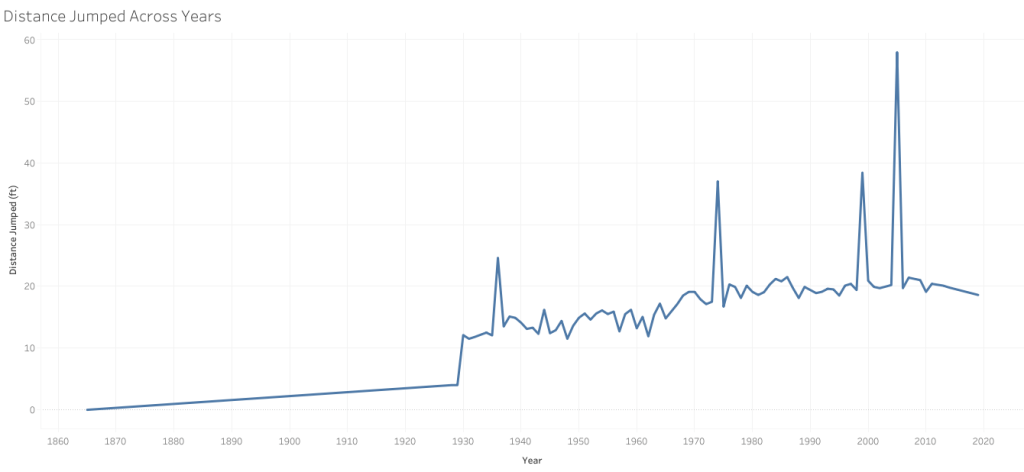
The viz above shows the distances jumped across the years, and how it’s changed and where the trend is at the moment. The harder spikes represent the world record holders, of which there are 13 total recorded.
In the beginning of the line chart there is a long, flat line from about 1800 to 1930, which represents a gap of recorded jumpers that are present on the boardwalk. That information is available, but not in the dataset that I created.
I also calculated the sum of total feet jumped, and all of these accomplished frogs have jumped a total of 1,459 feet over nearly 200 years (that we know of)!
Of all of our all-star amphibians, 6 of them are repeat winners with at least 2 wins. Can’t Take It takes the cake with 4 total wins!
Owners– and renters, too– which include teams as well as individuals, have more repeated wins, with 8 separate owners at at least 2 wins. Individual Roy Weimer tied with the team of Bill Proctor & Leonard Hall for 6 repeated wins! Denny Matasci is the only one at 4, and we have 3 owners–Eddie Robbinson, Lee Guidici, and Louis R Fisher– at 3 wins a piece.
It was really fun to finally get to these numbers, especially since as I was entering them I noticed a lot of repetition. I love how specific I can get with this, and what I can show. And honestly, it was just a lot of fun customizing everything to make it fit the theme of the data.
Final Viz
I went back and forth on what I wanted to do with the dashboard. Or if I wanted to do a story. My vision was essentially create something fun and cute, since the data doesn’t show off any serious or intense subject matter.
This was what I came up with and ended up being happiest with.
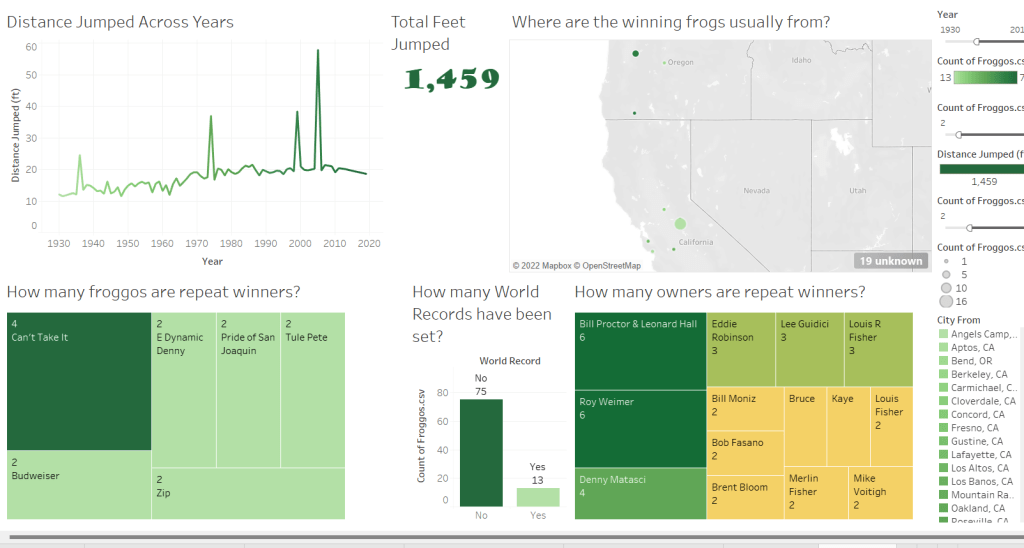
I didn’t get a froggy image in there like I wanted to originally, but I really love the layout and how this ultimately turned out. It’s fully interactive with filters to help keep the data clean, you can play with it here.
Conclusion
This was fun from beginning to end. It was something my partner and I came up with on a vacation, and I took almost 90 photos on my phone, nearly overheating the thing. All in the name of data!
I feel as though it being a small amount of data invalidates it in some way as far as my work and visualizing it in a themed dashboard like this, but I like to think it shows my ability to focus on design, getting across an idea while putting things in places that make sense and maximize on the space they need.
I did want to reshare the Github link, where you can find my data in CSV format if you’d like to do your own work on it!
This is a link to another git with the same theme but different data.
This has been a lot of fun as a project, and I’m glad you decided to check it out! Next up I’ll probably talk about my work with the Google Data Analysis Certification program.
Thank you again for dropping by to read my frogblog, and may your data cleaning be swift and your vizzes gorgeous!

Leave a comment