I originally wanted to call this post Struggle: A Post about Learning R, but I needed to keep with my typical naming conventions, so here we are instead.
I spent most of my time working through the Google Data Analytics Certification looking forward to Course 7, where I’d learn how to use R. I had tried over the summer to see if I could learn R just by doing a project, but plunging myself in to the deep end like that felt incredibly overwhelming.
Still, I was excited to learn more about the language and add it to my toolbox and see what I could do with it, what the limitations were. I thought I’d have an edge because, even though the instructor kept reminding us that the learning curve for R was steep, I’ve learned Python in the past. So I had programming language basic knowledge.
The problem with that line of thinking is that Python is pretty simple by most programming language standards. It’s got more on the side of being more intuitive and it has a relatively easy syntax.
Unlike Python, however, R is focused more specifically on statistical analysis and visualizations, and cleaning (how many times have I had to load up tidyverse now…?). Python can do anything from web development to visualizations to game creation, it’s incredibly versatile and has a lot of packages.
In comparison, R is less of a multitasker than Python.
I will say I was excited for R for that reason, though. After taking a statistics class this past summer, having to do calculations for the standard deviation and margins of error and z scores and p values, it was like watching the world open up before me to see R do a standard deviation calculation in a simple formula. Dang.
R is also able to put together a multi-point scatter plot with distinctions for each point, and a multi-line graph in a simple enough formula.
I will say it’s easier to understand what I’m doing when I know what the syntax does. For example, I saw this formula, which creates a scatter plot for the Palmer Penguins dataset, at the beginning of the course, and was boggled at what it meant or how the plot was achieved at the time.
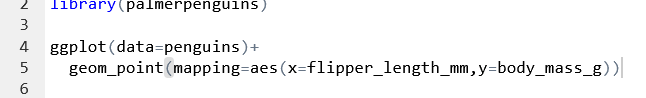
Now I know that I can change geom_point to geom_bar, add color, that ggplot(data=) is just the way to call the package and the data we’re trying to map, and that mapping means what you want to show up on the visualization. I can pick this apart and add to it and I feel like I have a solid understanding of that part of the language.
When it comes to cleaning… Less so.
I will say the course was interesting… I feel like in some parts it was constantly going over smaller, easier to understand things like how to download and install the tidyverse, and in other parts it only went over more complex topics like how to filter and organize data once, and didn’t linger. I feel like I have the install and loading of packages drilled into my brain but trying to find and fill null values is going to take some digging and practicing again because we didn’t cover it as deeply or as often.
I will say that I do recommend it if you’re looking into data analysis or data science. R is an incredible tool for statistical work and it’s great at doing more complicated visuals without too much fuss. It’s an incredible tool to have in general, but especially if you’re looking to do more mathematical work.
Python is great, but what it can’t do, R does exceedingly well.
The course itself within the Google Certification is… Not bad. It’s a good place to start. I got very frustrated with some of the concepts that weren’t covered very deeply, but I intend to go back through the videos again until I get it.
A lot of the syntax doesn’t feel very intuitive. Doing more than one function at once requires %% (what they called a pipe), and you assign things with a <-. Learning when certain symbols need to be involved is a whole other can of worms.
I’m a little hesitant to dip my toes outside of my comfy ggplot2 and tidyverse, but there’s probably so much more that’s possible that I’m not even touching on. I’d love to get to a point with R where I’m comfortable doing any cleaning and then visualizing like I do with Python, but considering some of the warnings about the learning curves, I’m sure I’m going to have to struggle through a couple of projects before anything becomes second nature, or just easier.
If you’re still thinking about whether you should jump into R, I recommend it, but make sure you have the time to focus, and spend time learning about everything you’re inputting. At least for me, I find that when I know what something does, it’s easier for me to figure out when and how to use it.
A shout out to Rstudio Cloud by the way, which is such a fun, nice little tool to have just in your browser. Nothing to download, just get the cloud going. I think the name has changed to Posit, though.
Whether you’re also learning about R this week, or you’re focusing on something else entirely, I hope your data is good to you, and I’ll see you next week!

Leave a comment