This report is on the capstone project for the Google Data Analytics Professional certification. Some of the work has been done already in Python, but I wanted to finish the rest of it as a case study for the capstone project.
The following is a report on the analysis and findings of the most popular ice cream brands, their products, and customer ratings, in order to give better understanding of where to begin for the fledgling ice cream company Tiger Stripes. The data was taken from Kaggle.com, a dataset uploaded in 2020, that spans the four better known ice cream brands: Ben and Jerry’s, Häagen-Dazs, Breyer’s, and Talenti. Cleaning and validation was done with Python, the pandas library. Further analysis was done with SQL through BigQuery. Visualizations were done in Tableau.
***
Here at Tiger Stripes, we’re hoping to pave the way to new ice cream, but to do that, we need to know where to start. Our company still being in its infancy, there was consideration that a preliminary analysis of other, more popular brands would help us figure out where to venture out with more adventurous flavors.
It is important to note that the dataset used for this analysis is a couple of years old at this point, and while there’s an extensive amount of customer feedback, it’s not anywhere near being a full consensus on where our country fully agrees on flavors, both typical and more adventurous. There are a lot of limitations to this set of datasets being the only ones analyzed, but it was a place to start, and though the impact of it will not be as significant, the team at Tiger Stripes thought it would still be helpful.
First, we get into the visualizations, with some of the data we’ve gotten from SQL and put through Tableau.
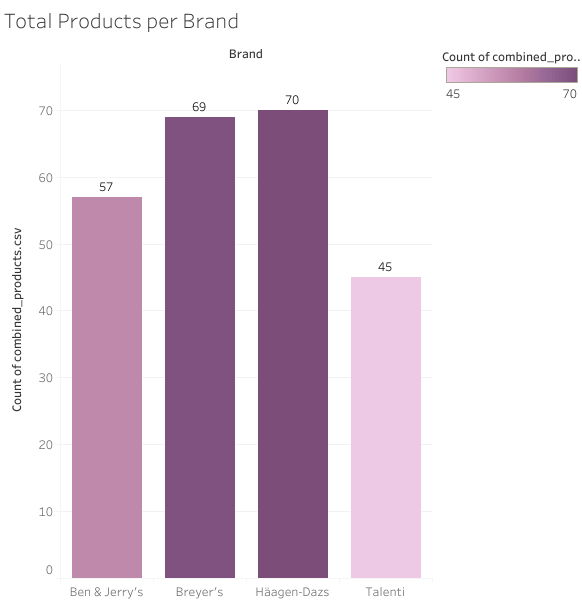
The analysis begins with products per brand to get an idea of what each brand that we’re looking at has and we’ll see if it affects their ratings. It was surprising to find that Ben & Jerry’s didn’t have the most products. After a quick look in the ice cream aisle, it feels as though the Ben & Jerry’s is the most prevalent. Breyer’s and Häagen-Dazs have the most products, at 69 and 70. Talenti, the Italian gelato brand, has the least at 45.
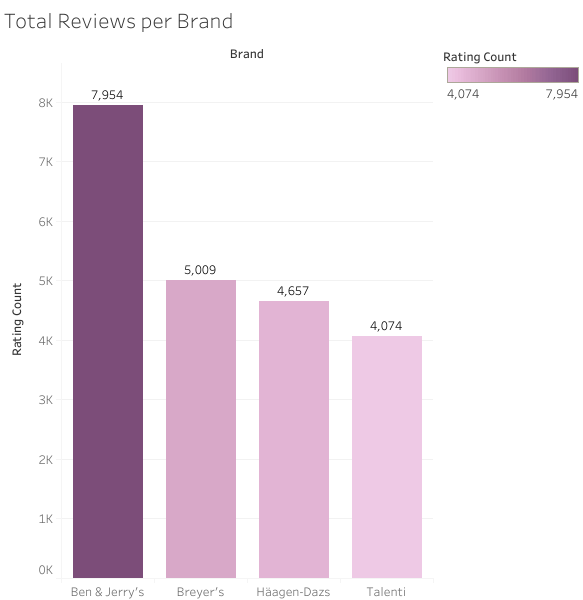
I like seeing these two visualizations side by side, because despite having more products, the one with the most reviews is Ben and Jerry’s. Talenti is at the bottom. Ben & Jerry’s takes the lion’s share of the total reviews overall, and is closing on double the amount of Talenti, let alone being close to doubling the second best, Breyer’s.
This gives a great view of the marketing as well, in my opinion. Ben and Jerry’s is a household name, and they have some pretty phunky flavors. Their products and their naming conventions are adventurous to say the least and I feel like that works in their favor, especially considering how many people have reviewed them, good or bad. The engagement in general can be argued to be a great thing because even if they did get bad reviews, it would still interest someone else. Too many nuts? Might be a pass for one person, but perfect for another.
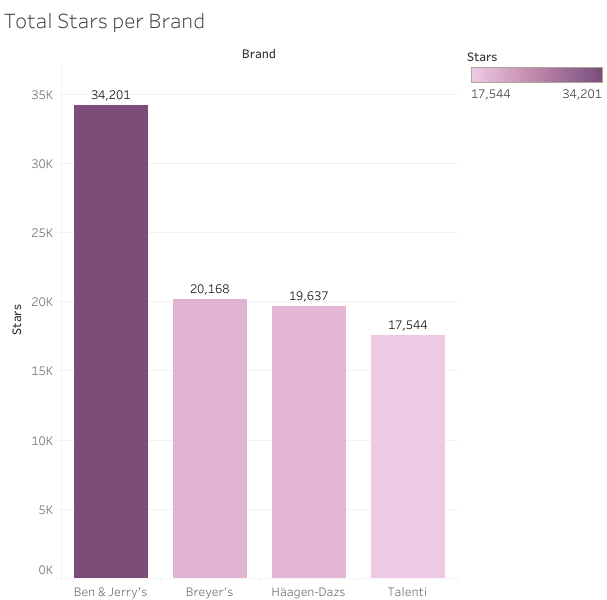
Next up we have total stars per brand. This one and the next are important. This goes into what I was saying about engagement, and it follows a similar trend as the total reviews, which is no surprise. By far, Ben & Jerry’s has the most stars, and it’s interesting to note that this is between 1 and 5 stars, not just 5 stars. If you take their total reviews versus their total stars, you’ll get our next visualization, which is an average of the stars for each brand.
Below is another visualization, average stars per brand.
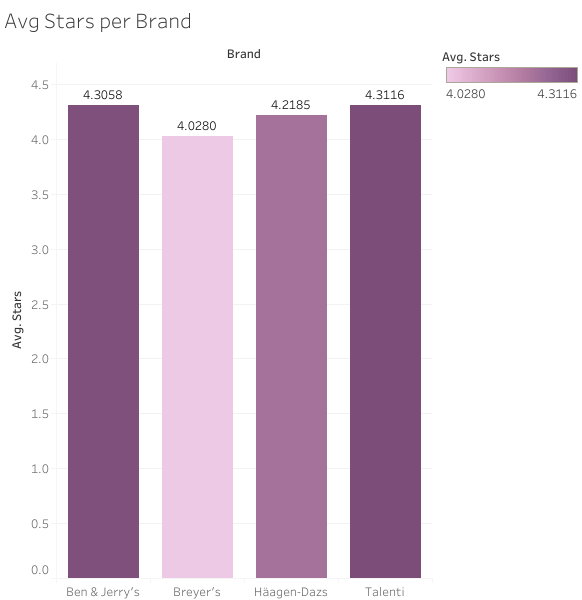
Despite being bottom on products, reviews, and stars, Talenti takes the top from Ben and Jerry’s. This is important to note for a couple of reasons. One reason being that there is a bit of skew here, since Talenti has less of just about everything, it hasn’t gone through the same type of trials in review and public opinion. It hasn’t been as thoroughly reviewed as the B&J brand. So the skew here is that the people who have reviewed the Talenti brand products tend to like them, but there are not as many reviews as any of the other brands, let alone Ben & Jerry’s.
Interesting to note too is that even with a plethora of reviews and stars that B&J has, it doesn’t seem to drag their rating down at all.
It could also be argued that the inclusion of B&J is skewing the results in this visualization by having so many more reviews and stars in the first place. Is it then fair to have them in a group with a brand that has the opposite problem, and two other brands that are in the middle of the pack?
This visualization says a lot and wouldn’t have been included I think, other than for an understanding of rating systems and seeing that an average star rating can’t necessarily be trusted in one case but can in another.
Here’s one last visualization. The top 15 ice creams.
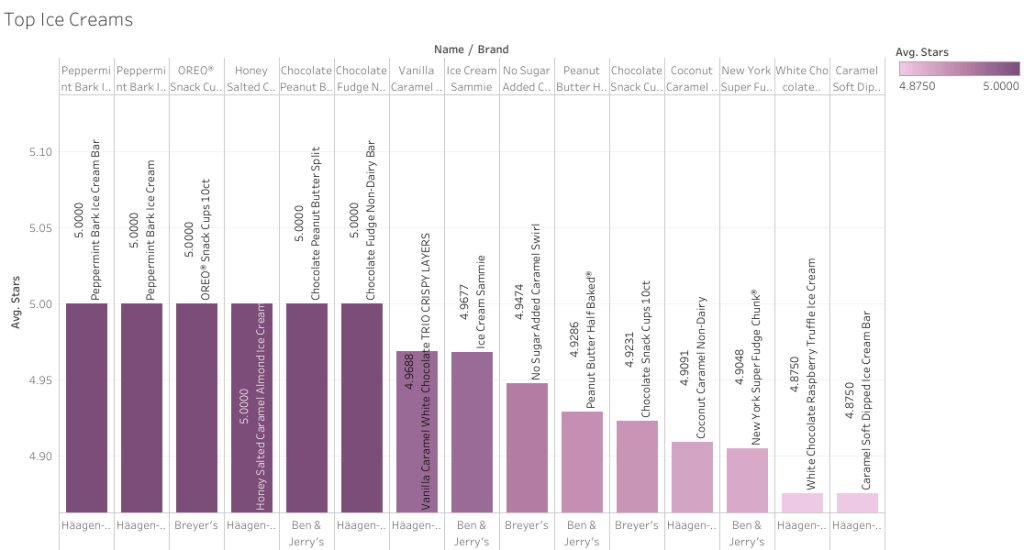
This one is very interesting. In a group of the 15 best ice creams, we have six that are at the top. It’s very important here to know that the total number of reviews is not on this viz but that the corresponding numbers for that may show that there are not as many reviews.
Considering that Ben & Jerry’s has so many reviews and even stars, it’s curious that their products aren’t more prevalent in this visualization. That goes again to seeing that Häagen-Dazs doesn’t have as many in comparison, neither does Breyer’s. Despite being the highest average star brand, Talenti does not show up at all on this list.
This is definitely suffering from bias, in my opinion. Personally I didn’t want to crowd the rest of the viz, but I think the total amount is very important here because some of these could be more fair than others.
I did want to include it because it’s interesting to see what people like regardless of how many those people are.
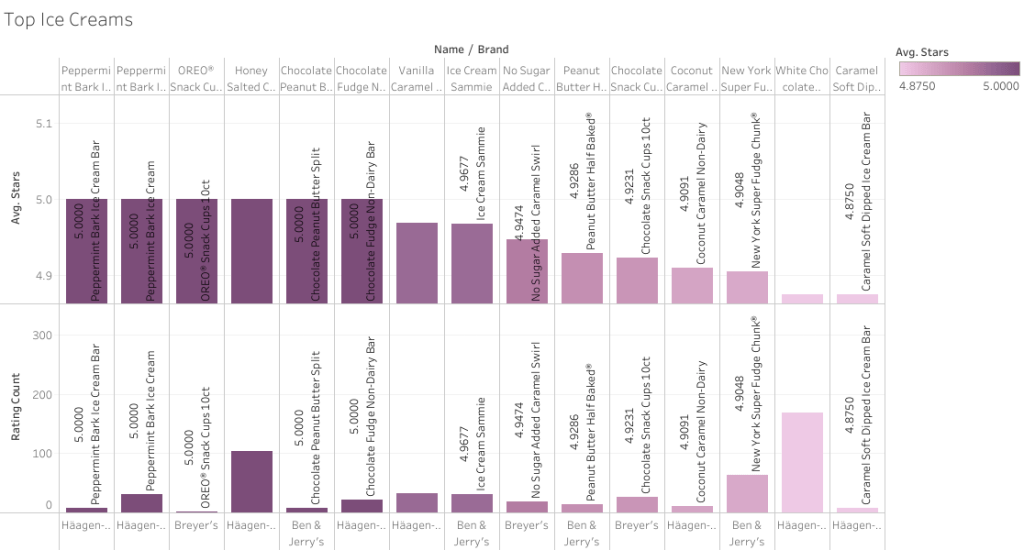
Below I’ve put together the list of each ice cream, but this time I’ve added the total amount of reviews as well so you can see whether it’s a fair rating or not.
The list, in order of brand name, name of ice cream, average star rating, and amount of ratings:
- Häagen-Dazs – Peppermint Bark Ice Cream Bar – 5 ⭐ – 8 ratings
- Häagen-Dazs – Peppermint Bark Ice Cream – 5 ⭐ – 31 ratings
- Breyer’s – Oreo Snack Cups 10ct – 5 ⭐ – 2 ratings (least in group)
- Häagen-Dazs – Honey Salted Caramel Almond Ice Cream – 5 ⭐ – 103 ratings
- Ben & Jerry’s – Chocolate Peanut Butter Split – 5 ⭐ – 7 ratings
- Häagen-Dazs – Chocolate Fudge Non-Dairy Bar – 5 ⭐- 22 ratings
- Häagen-Dazs – Vanilla Caramel White Chocolate Trio Crispy Layers – 4.9688 ⭐ – 32 ratings
- Ben & Jerrry’s – Ice Cream Sammie – 4.967 ⭐ – 31 ratings
- Breyer’s – No Sugar Added Caramel Swirl – 4.9474 ⭐ – 19 ratings
- Ben & Jerry’s – Peanut Butter Half Baked – 4.9286 ⭐ – 14 ratings
- Breyer’s – Chocolate Snack Cups 10ct – 4.9231 ⭐- 26 ratings
- Häagen-Dazs – Coconut Caramel Non-Dairy – 4.9091 ⭐- 11 ratings
- Ben & Jerry’s – New York Super Fudge Chunk – 4.9048 ⭐- 63 ratings
- Häagen-Dazs – White Chocolate Raspberry Truffle Ice Cream – 4.8750 ⭐- 168 ratings (most in group)
- Häagen-Dazs – Caramel Soft Dipped Ice Cream Bar – 4.8750 ⭐- 8 ratings
Häagen-Dazs is over half this list. Unfortunately, I was hoping this list would provide some kind of insight into what people like and what they tend to review and show up for. I think this is biased but it’s still a good list to look at.
The visualization for this list looks like this, showing the clear divide between those with more ratings and those with fewer. It is the bottom visualization in this image.
To see and interact with all of my visualizations, please feel free to visit this link.
Wrapping this up, I want to touch on a couple of things. One is recommendations. I’ve pointed out that some of this data is not only outdated but biased. I still think that it’s useful regardless of that, and want to also share my insights.
Insights first, I will say that it’s clearer to me that Ben & Jerry’s and Häagen-Dazs are fan favorites despite having very different amounts of ratings and stars. The whole purpose of this analysis was to see what would help with Tiger Stripes and their first ventures into flavors past the typical few (vanilla, caramel, chocolate, etc).
Taking a page from both of them is to say that stepping just outside of popularity with more adventurous flavors is a good way to gain interested customers. Peanut butter, white chocolate, honey salted caramel, all of these are popular but not the most, and so when you create a flavor that includes them, you gain people who may not be catered to in other ways. Finding a new twist on these flavors is a good way to gain attention, too. You don’t have to reinvent the wheel by any means, but finding a fun way to include the flavors is all you need to do.
This flows directly into my recommendations, the first of which is to get some taste testers and due blind studies. If we’re hoping to have as much of a reach as some of these brands we’ve looked at, then we want to push and spend the money we need to make sure that what we do is a hit.
Another recommendation is to make sure that we get more data. Look into marketing data for each of these brands and see where they sell and how wide their range is across our country. This will help us get a better perspective of customer interests and where the pockets of different flavor interest might be.
My final recommendation is to find data from other brands, or at least find more recent or relevant data. We can also look just local, especially if we’re hoping to establish a shop in our city. See if there’s data that we can find that may be relevant to this for our city specifically and then build from there.
We aren’t going to be able to push a lot, all at once, immediately. It’s important to remember that we’re just starting. These insights and analyses are at the very base level and are only for us to see what’s going on with other very successful brands and find a couple of very good, solid steps in those directions.
I’m happy to do any other analyses or visualizations for anything you can think up, and soon we’ll have our own data to work on. I’m excited to see where the Tiger Stripes brand will stretch!

Leave a comment